As a challenging part of working at the NefisYemekTarifleri.com, first three days Ramadan is the busiest time for us. We get max requests during that period. So, I just wanted to highlight some stats for taking note to myself and sharing some stats about WordPress at scale.
Highlights
Max session rate: 615
Max sessions: 8015
Unique Visitor: ~2M/day (including mobile apps)
Pageviews: 5M+ /day
App Screenviews: 25M+ /day
Memcached Instances:
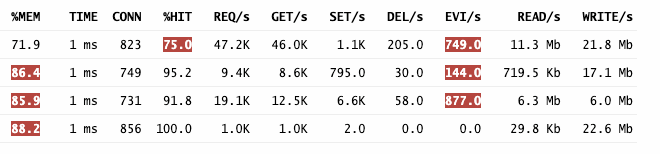
NefisYemekTarifleri.com is not just a “read-only” platform, so varnish is not able to solve all caching problems, and we have a large number of logged-in users. In this case, the persistent object caching is the solution.
We split caching groups across multiple servers, this is why options cache hits %100. (none of them is crucial as much as “options” group)
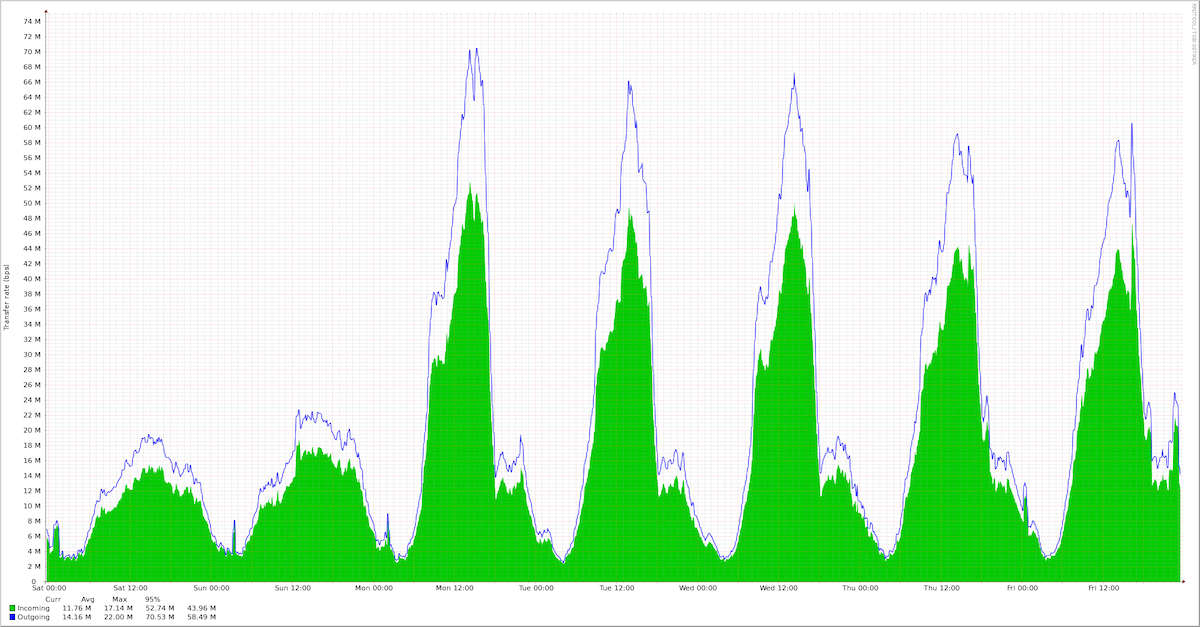
Loadbalancers (HAProxy)

Loadbalancers consume pretty normal bandwidth, not a big deal 🙂 And we served ~72M requests within ~110 hours.
CDN
We split CDN traffic between multiple providers and one of them is not providing real-time stats. So, it’s hard to say a certain number, but as my previous experience probably we’ve seen ~2.6 Gbps
MySQL
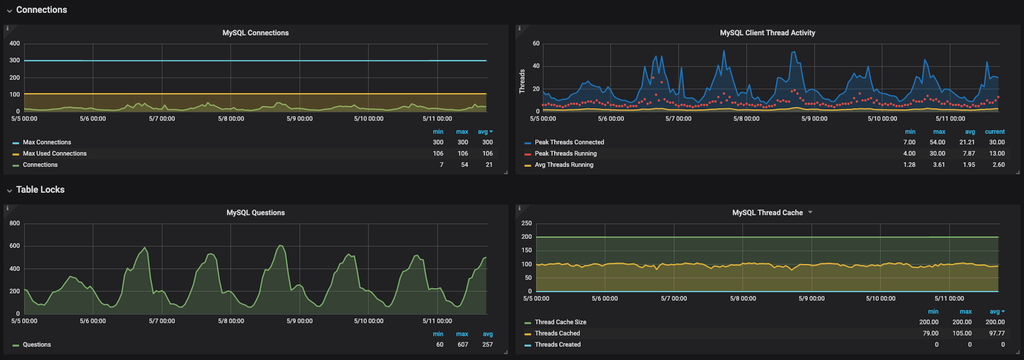
MySQL instances run smoothly, and we didn’t do anything specific to MySQL at this year.
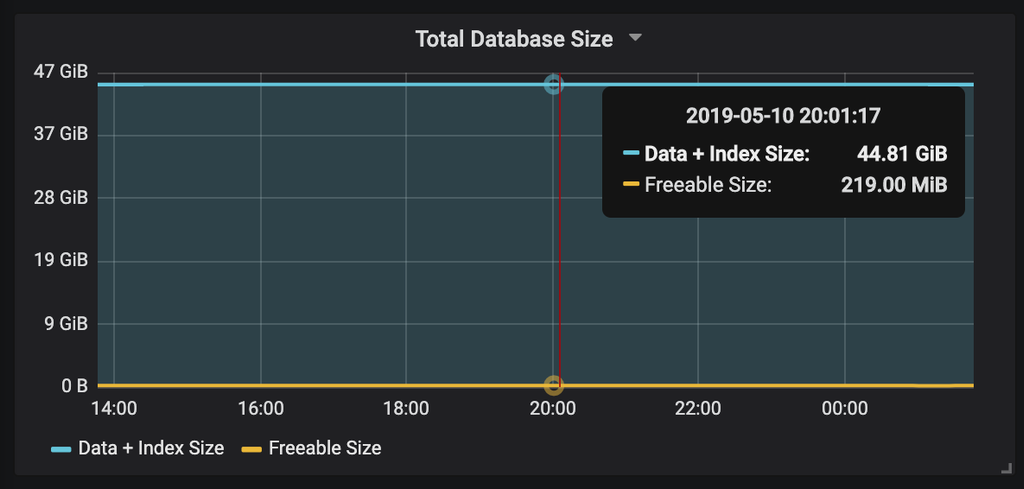
In terms of row count, usermeta contains 32M+ rows and the biggest table is postmeta which is around 8G.
Overall we made the right calculations in terms of resource scheduling, and I hope that stack keep serving without any issue 🙃
We occasionally share stats under the #nytstats hashtag on Twitter, you can keep following future updates.

Leave a Reply